Artifact 05
Measuring Adaptive Speculative Decoding in SGLang with EAGLE3 on Triton

I do not know if it is my poor luck or my mind, but after failing to measure spec-decoding myself, I realized that SGLang has already merged adaptive speculative decoding.
Technically, the controller takes the accepted draft count from every request in the batch, averages them into one number, smooths it into an EMA, and picks K from that.
and that one sentence is the whole design, so let me say it in slower words. imagine 32 requests running together. and A few of them are chewing through very predictable text and accepting four or five drafts every round. A few others are writing something open ended and accepting almost nothing. SGLang adds all of that up, divides by 32, and gets one number. That number picks the depth for everybody in the batch.
actually I kept coming back to that. If every request has its own curve of how likely position k is to be accepted, why throw the curve away and keep a mean? The answer we give ourselves is that the curve belongs to the request, so the mean is a fair summary of something stable. It feels good & easy when you say it like that. I wanted to know if it is actually true.
- If the curve belongs to the request, why does one number work at all?
- What if the curve itself moves when you change K?
- And how would you even know, if you never measured it?
These are some questions I had while reading adaptive_spec_params.py. I did not want to argue about them, so I built a harness and rented one A6000 to go find out.
Let me first tell you what the harness actually does.
It runs the same workload at a fixed K, across a few concurrency levels. K = 1, 3, 5, 7 and concurrency = 1, 8, 32. That is 16 runs, plus one run with speculation switched off completely, so I have an honest floor to compare everything against.
Two controls I want to mention, because without them the whole grid is junk. Every server gets warmed up before I start timing it. The first requests into a fresh server are slower, Triton is still compiling kernels, the allocator is still growing, and at the few percent level we are chasing here, that warmup would show up as signal. And every server runs with --disable-radix-cache. Without that flag, the grid reuses the same seeded prompt pool across concurrencies on one server, so later runs would look cheaper than earlier ones purely because the cache got warm. I am not studying prefix caching, so I do not want it quietly moving my batch size axis.
Now came the tough part.
SGLang already hands you spec_correct_drafts_histogram for every request. It tells you how many rounds accepted 0 drafts, how many accepted 1, and so on up the chain. From that you can compute P(position k was accepted), which is exactly the curve I wanted to look at.
But that number only means something if K was held still.
Here is the problem. Say a request ran under adaptive K, and for most of its life the controller gave it depth 2. It accepts something at position 1, accepts at position 2, and then it finishes. Positions 3 through 7 are sitting there as zeros in that histogram. But the draft at position 3 was never proposed. Nobody asked the model that question. If I average those zeros into my curve, I am not measuring rejection, I am measuring absence, and those are two very different things.
And you cannot repair it afterwards. The information is not in the file. It was never written.
So I patched the fork to also emit an iteration level trace. Every decode iteration writes a line with the active K and the rids that were in that batch. Now I can bound K per request from the trace instead of assuming it, and I can throw away any request whose curve I do not trust. It writes about 31,000 of those lines across the three adaptive runs, and it makes the adaptive capture readable for the first time.
Then there is the oracle. Four levels of it, all scored on the deepest static capture, and all with a train and test split. That split is not decoration. A scalar policy with fine enough bins can put every batch in its own bin, memorise it, and report a gap of exactly zero no matter what the truth is. If you do not hold batches back, you will measure your own overfitting and call it a result.
But before I looked at any gap number, I wrote a gate.
Let me explain why, because the gate is the part I am happiest with.
Every level of that oracle needs to know what a request would have done at a depth it never actually ran. That is a guess. It is a fair guess only if the acceptance curve does not depend on K, which is the assumption everybody in this space quietly makes and almost nobody checks.
So I wrote the rule down first. Run the same workload, same seed, same batching, at K = 1, 3, 5, 7. Compare P(A at k) across those depths. If the curve moves when you move K, then the gap does not get reported at all.
I wrote that down before I had a single number from the GPU. Which is the only time you can write a rule like that honestly.
It failed.

P(accepted at position 1) is 0.440 at K=1. At K=3, 5 and 7 it is 0.376, 0.360 and 0.362. The same split shows up at every concurrency I ran, so it is not one noisy cell. And K=3, 5 and 7 agree with each other well inside the tolerance, which tells me the wobble is not random at all. It sits at the shallowest depth, and it is consistent.
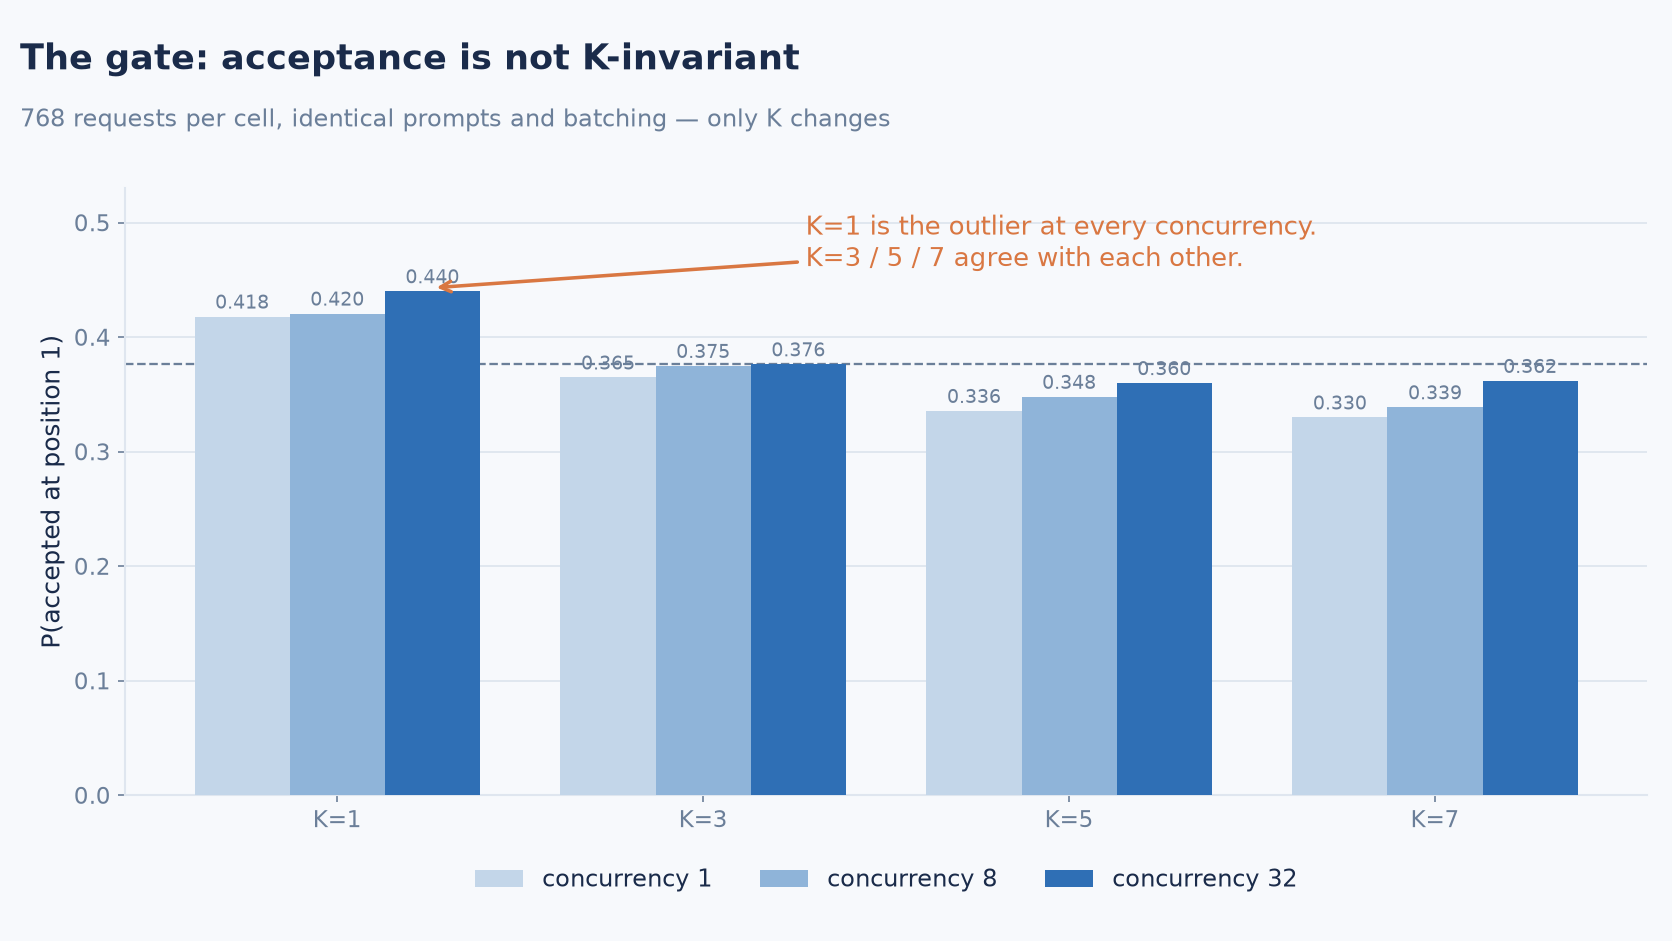
I did not argue with my own rule. The gap is not reportable, and I am not going to show you a number I cannot defend.
But the same session answered two other questions, and honestly those are worth more to me than the gap would have been.
The first one is that speculation lost to not speculating. At concurrency 32, the run with speculation switched off did 1049 tokens per second. The best speculative cell did 753. Turning speculation off made the server about 39% faster.
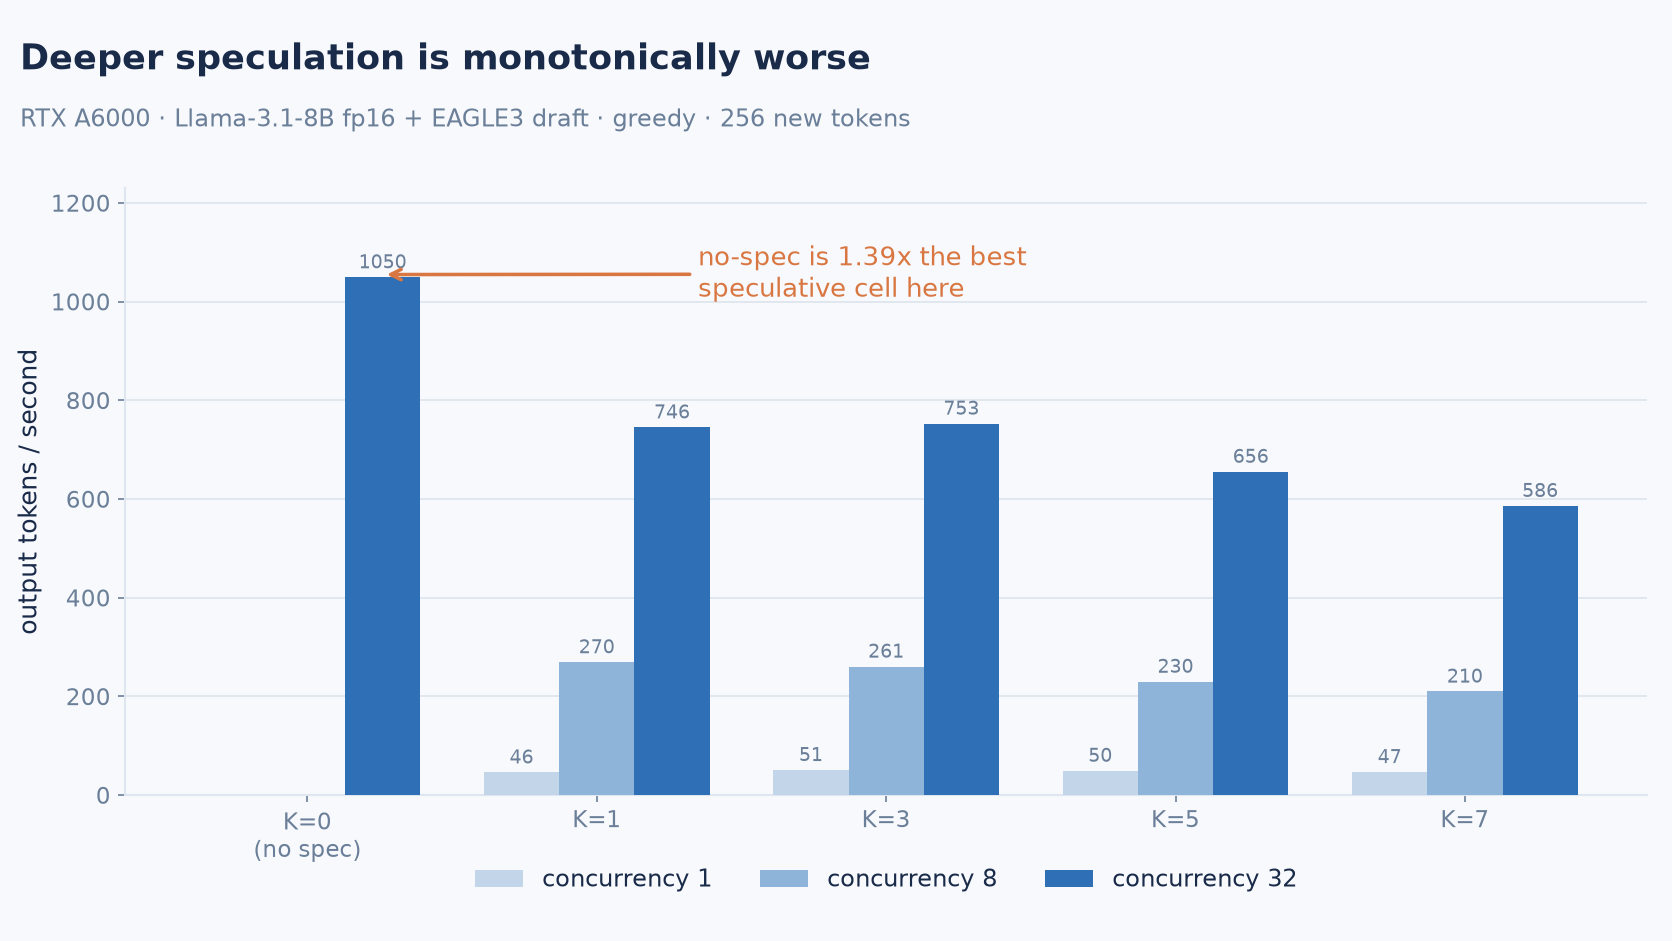
That surprised me, and then it made sense. The draft model is not broken, the arithmetic just does not work out. The number that matters is how many tokens you get for each position you push through the target model. At K=0 that number is 1.000, one token per position, by definition. At K=7 it is 0.239. So you are shoving 8 positions through a forward pass to collect 1.9 tokens at the end of it. Every extra draft position costs close to a full pass at this batch size, because the GPU is already busy, and the acceptance rate is nowhere near high enough to pay that back.
The second thing is that the heterogeneity I was actually hunting for is real. I just could not use my oracle to price it.
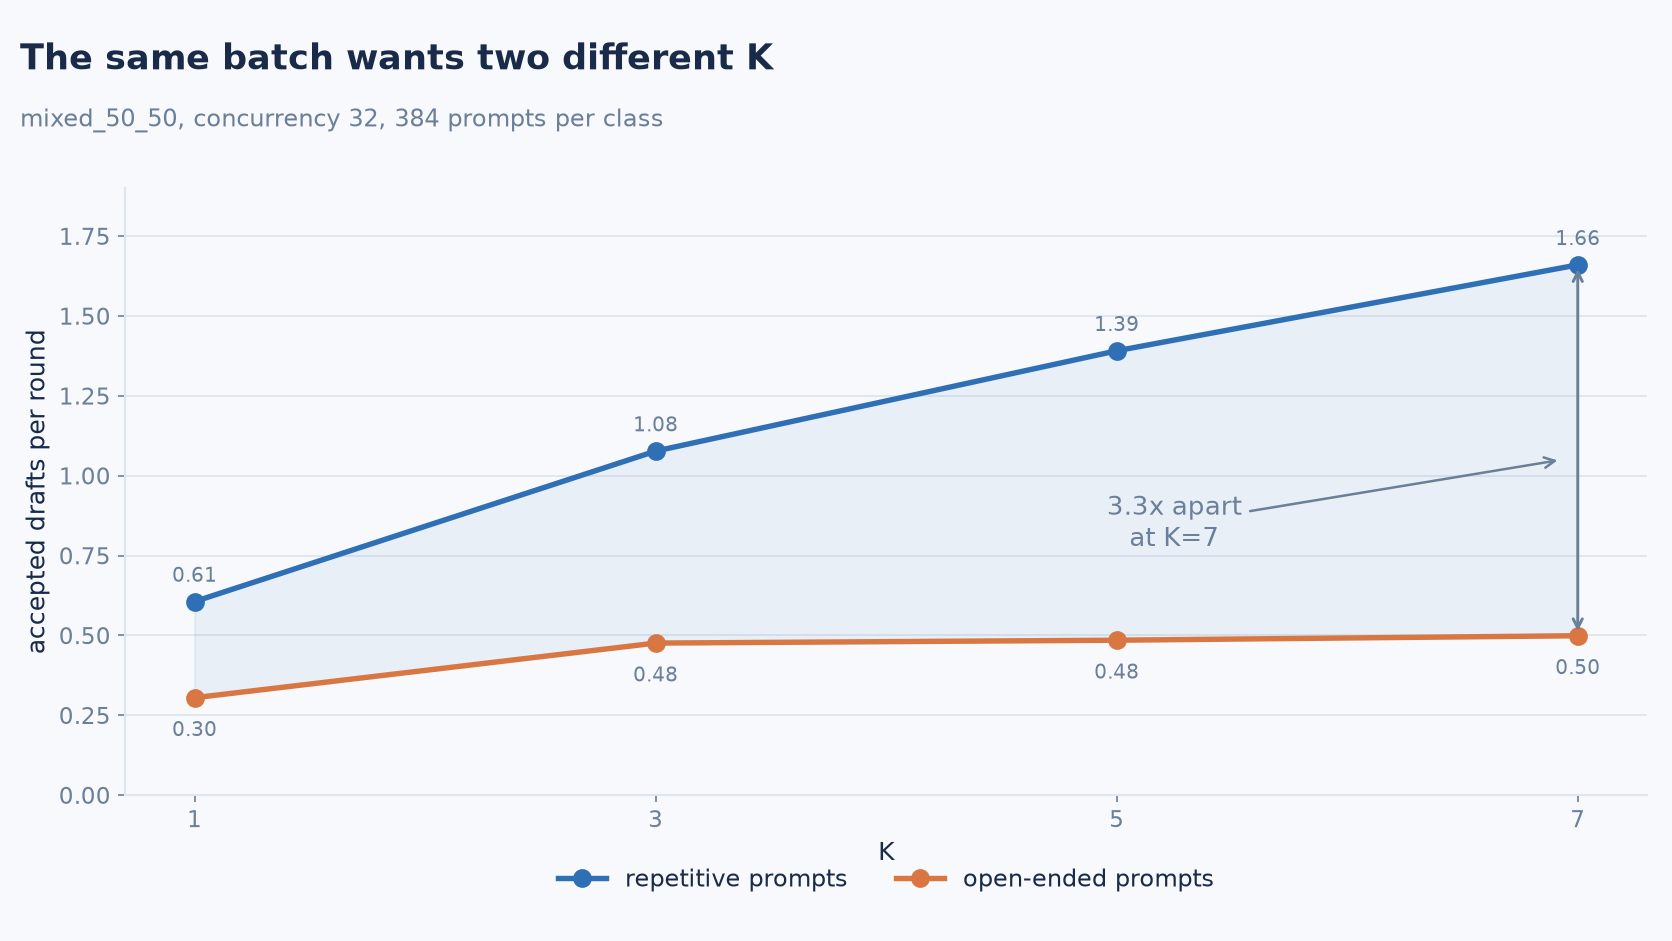
Same batch, same concurrency, same everything. The repetitive prompts hit 1.66 accepted drafts per round at K=7. The open ended ones sit at 0.50. That is a 3.3x spread inside a single batch, which is exactly the thing that made me think a single mean was a bad idea. The premise survived. What did not survive is the tool I built to measure it.
Before I trusted any of those numbers, I ran one correctness check, and I want to put it here because it bounds everything above it. At temperature 0, speculative decoding has to produce the same tokens as plain decoding. That is the deal. So I compared the completion length for every prompt across every K. 768 prompts at concurrency 32, and every single one matched exactly. The pipeline is lossless. So the throughput numbers are a real cost outcome and not a symptom of something being broken underneath.
Two bugs still ate real time, and I think they are the most useful part of this whole thing.
The first one I still think about. Every measured request came back as HTTP 500. Not some of them. Every one. And warmup passed every single time, on the same server, with the same prompts, hitting the same endpoint.
So I stared at that for a while. What is different between warmup and the real run? Same model, same temperature, same max tokens. The only difference was that my warmup code does not send a seed, and my measured code does.
It turns out the field in this SGLang is called sampling_seed, not seed. The server builds SamplingParams(**kwargs) from whatever you put in sampling_params, and it does not filter out keys it does not recognise. So my seed raised a TypeError on the server, and all the client ever saw was an empty 500 with no body. The actual error was sitting in the server log the whole time. I found it by reading the log instead of guessing, which is a lesson I had to learn twice in this project.
The second one was an exit code. The launcher died with -9, and if you have ever debugged a process on a rented box, -9 means the OOM killer and nothing else. That is what I assumed. I went looking at memory. It was not memory at all. SGLang had killed its own process tree after a ValueError in the draft model's context length check, and the launcher died as a side effect of that cleanup. The real error was three lines above the kill message in the log.
So both bugs had the same shape. The thing that killed me was not the thing that was reported.
The part that bothers me most is that over 400 tests passed on my laptop while the real server was rejecting every single request. My mock server accepted whatever payload I handed it, so nothing local ever checked whether I was speaking the same language as the real thing. It does not accept that anymore. If this project left one useful thing behind, it is probably that.
I stopped here. The gate said the method cannot answer the question, and I would rather write that down than publish a number I cannot stand behind.
If I run this again, the first thing I change is the attention backend. SGLang's own EAGLE3 tests run flashinfer. I ran triton, because it kept flashinfer off the attention path and saved me pulling a wheel. I never wrote down what that convenience cost me, and that was careless. The verify pass attends over K+1 positions at once, which is exactly the kind of shape a backend handles well or badly. So my cost numbers describe EAGLE3 on triton, and not EAGLE3. That is the honest boundary of what I measured here.
Which is the artifact for me. Not "adaptive K does not work." I wanted to know what one scalar throws away, and I found out the harder way, that the curve it summarises does not hold still long enough for anyone to compare it across K.